
Document Health Gallery feed (extension)

Shows inline diagnostic messages and gutter glyphs, with inline/above/below placement and a scroll bar health icon.
▼ Download- Author
- Mads Kristensen
- Version
- 1.1.69
- Updated
- 1 month ago
- Tags
- errors, warnings, health
- Supports
- VS 2022 VS 2026 VS 2022 (ARM64) VS 2026 (ARM64)
Document Health for Visual Studio


Download this extension from the Visual Studio Marketplace or get the CI build.
A lightweight Visual Studio extension that focuses on inline error/warning messages and margin glyphs (gutter icons), with optional line highlighting and an icon on the scroll bar for at-a-glance status.
Features
Inline Error Messages + Margin Glyphs
See diagnostic messages directly in the editor:
- Inline messages render at the end of the affected line (default)
- Above / Below positions render on a separate line above or below the affected code
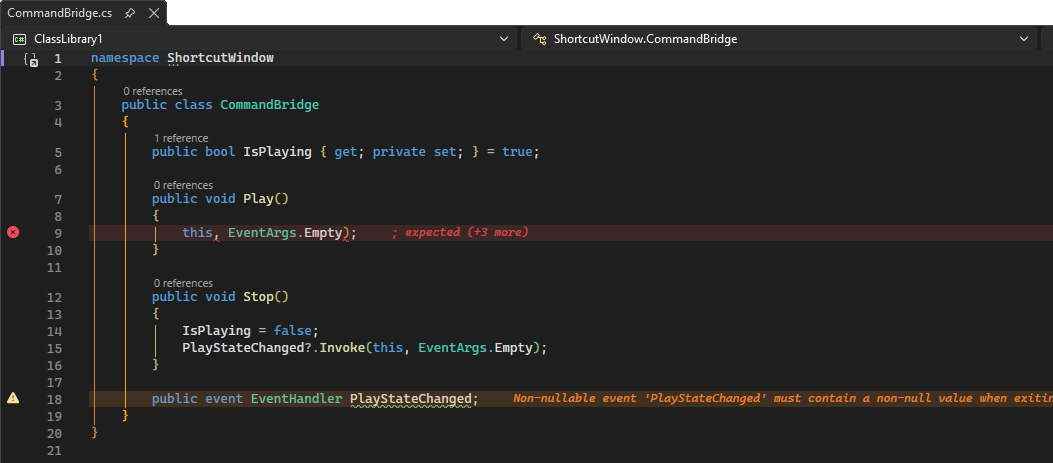
You also get margin glyphs (gutter icons) for lines containing diagnostics, using severity-based coloring:
- 🔴 Error
- 🟡 Warning
- ℹ️ Information (suggestions)
Right-click an inline message or gutter icon to copy diagnostic text/code, search online, or quickly toggle display options.
At-a-Glance Status Indicator
An icon at the top of the scroll bar shows your document's health:
| Icon | Status |
|---|---|
| 🟢 Green | No errors or warnings |
| 🟡 Yellow | Warnings present |
| 🔴 Red | Errors present |
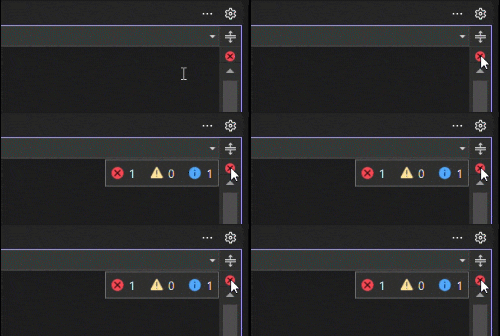
Hover for Details
Hover over the icon to see the exact count of errors, warnings, and messages.
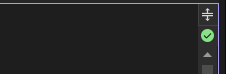
Cleaner Editor Layout
By default, this extension replaces the built-in Document Health Indicator at the bottom left of the editor, freeing up space for the horizontal scrollbar.
You can keep the built-in indicator if you prefer (see Options below).

Keyboard Shortcuts
Use Visual Studio's built-in shortcuts to navigate between issues:
| Shortcut | Action |
|---|---|
Ctrl+Shift+F12 | Go to next error |
Alt+PgDn | Go to next error/warning |
Alt+PgUp | Go to previous error/warning |
You can also click the icon to jump to the next error, or right-click to access additional options:
- Go to Next/Previous Error
- Open Error List
- Display toggles (see below)
- Settings
Inline Diagnostics
See diagnostic messages directly in the editor, right at/near the line that caused them — no need to check the Error List.

Message placement can be configured as:
- Inline: at the end of the affected line (default)
- Above: rendered on a separate line above the code, aligned to indentation
- Below: rendered on a separate line below the code
Right-click on any inline diagnostic message to access a context menu with useful actions:
- Copy Diagnostic Message — Copy the diagnostic text to the clipboard
- Copy Diagnostic Code — Copy the diagnostic code (e.g., CS0168) to the clipboard
- Search Online — Search for the diagnostic on Bing to find solutions
- Display — Quick toggles for display options (see below)
Message Templates
Customize the format of inline diagnostic messages using a template string. The default template is {message}, which shows just the diagnostic text.
Supported placeholders:
| Placeholder | Description | Example |
|---|---|---|
{message} | The diagnostic message text | The variable 'x' is declared but never used |
{code} | The diagnostic code | CS0168 |
{severity} | The severity level | Error, Warning, Info |
{source} | The analyzer/source name | — |
Example templates:
| Template | Result |
|---|---|
{message} | The variable 'x' is declared but never used |
{code}: {message} | CS0168: The variable 'x' is declared but never used |
[{severity}] {message} | [Warning] The variable 'x' is declared but never used |
{severity} {code}: {message} | Warning CS0168: The variable 'x' is declared but never used |
Gutter Icons
Diagnostic icons appear in the editor gutter (left margin) for lines containing errors, warnings, or suggestions. The icons use the same severity-based colors as the scroll bar indicator:
- 🔴 Error icon for errors
- 🟡 Warning icon for warnings
- ℹ️ Information icon for suggestions
Right-click on any gutter icon to access the same context menu as inline diagnostics (copy message, copy code, search online, display toggles).
You can configure which severity levels show gutter icons in the options.
Line Highlighting
Lines with errors or warnings are highlighted with a subtle background tint colored by severity:
- Red tint for errors
- Yellow tint for warnings
- Blue tint for suggestions (when enabled)
Both features can be toggled independently in the options.
Quick Display Toggles
All context menus (inline diagnostics, gutter icons, and the scroll bar indicator) include a Display submenu for quickly toggling display options without opening Tools → Options:
- Inline Messages — Show/hide inline diagnostic text
- Highlight Lines — Enable/disable line background highlighting
- Errors / Warnings / Suggestions — Toggle which severity levels are displayed
- Gutter Icons — Show/hide gutter margin icons
Changes take effect immediately.
Customizable Colors
All diagnostic colors can be customized through Visual Studio's native Tools → Options → Environment → Fonts and Colors page. Look for the Document Health items:
| Display Item | Foreground (inline text) | Background (line highlight) | Default Color |
|---|---|---|---|
| Document Health - Error | Inline error message color | Error line highlight | Red (#E45454) |
| Document Health - Warning | Inline warning message color | Warning line highlight | Orange (#FF942F) |
| Document Health - Message | Inline info message color | Info line highlight | Blue (#00B7E4) |
Each entry also exposes Bold and Italic options for the inline message font style. Colors update live when changed — no restart required.
Options
Configure the extension under Tools → Options → Environment → Document Health:
Behavior
| Option | Description | Default |
|---|---|---|
| Update delay (ms) | Delay before updating the indicator after changes. Higher values improve performance during rapid typing. | 250 |
| Show messages count | Include suggestions and informational messages in the tooltip count. | true |
| Replace built-in indicator | Disable Visual Studio's built-in file health indicator and use this extension's indicator instead. | true |
| Update mode | Controls when inline diagnostics are refreshed. 'Continuous' updates as you type, while 'OnSave' only updates after the file is saved. | OnSave |
Inline Diagnostics
| Option | Description | Default |
|---|---|---|
| Show inline messages | Display diagnostic messages inline at the end of lines containing errors or warnings. | true |
| Show gutter icons | Controls which severity levels get gutter icons in the editor margin. Options: None, Errors, Errors and Warnings, All. | Errors and Warnings |
| Show errors | Include error diagnostics in the inline messages and line highlights. | true |
| Show warnings | Include warning diagnostics in the inline messages and line highlights. | true |
| Show suggestions | Include informational and suggestion diagnostics in the inline messages and line highlights. | false |
| Highlight lines | Controls which severity levels get line background highlighting. Options: None, Errors, Errors and Warnings, All. | Errors and Warnings |
| Message placement | Controls where inline diagnostic messages are rendered relative to the affected line. Options: Inline (end of line), Above (separate line above), Below (separate line below). | Inline |
| Message template | Customize the format of inline messages using placeholders: {message}, {code}, {severity}, {source}. | {message} |
Notes on behavior
- The indicator performs an initial health calculation when a document opens.
- Updates use debounce behavior, so rapid typing delays refresh until activity settles.
- Gutter icons and inline messages share the same context menu for quick access to diagnostic actions.
How Can I Help?
If you find this extension useful:
- ⭐ Rate it on the Visual Studio Marketplace
- 🐛 Report bugs or request features
- 🔧 Submit a pull request
- 💖 Sponsor me on GitHub